

Microsoft is giving web developers a new way to understand and fix slow-loading web apps with a feature called Network Efficiency Guardrails in Microsoft Edge. Designed for large, modern web applications that pull in content from many different sources, this feature helps identify which resources are hurting performance the most. Instead of guessing which scripts, images, or data assets are slowing things down, developers can now ask the browser itself to flag inefficient patterns automatically.
According to Microsoft’s announcement, Network Efficiency Guardrails is available for testing in Microsoft Edge starting with version 146, and it focuses on spotting resource-loading patterns that tend to degrade user experience. The idea is simple: once you opt in via a document policy, Edge monitors your app’s network usage and reports “violations” when it detects wasteful behavior. Developers can then use those reports to prioritize fixes that will deliver the biggest performance wins.
What Network Efficiency Guardrails actually does
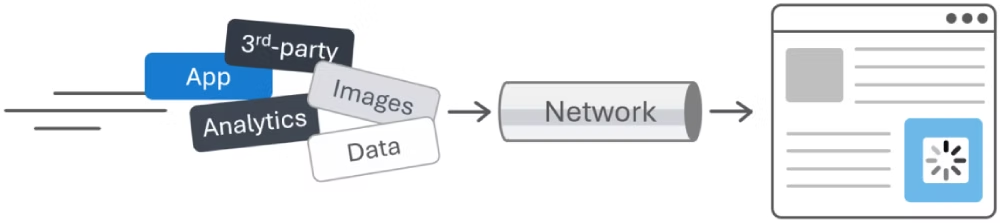
Large web applications frequently embed first-party and third-party content, each loading their own data, scripts, and media. When all of this competes for limited network bandwidth, congestion can quickly build up and make pages feel slow or janky. Network Efficiency Guardrails aims to surface exactly where that congestion comes from by watching for specific patterns that are known to be problematic.
Right now, Microsoft Edge uses three main criteria when the feature is enabled:
-
Text-based resources that are not HTTP-compressed.
-
Images larger than 200 kB.
-
data:URLs larger than 100 kB.
These thresholds are based on aggregate real‑world data, industry best practices, and findings from the Web Almanac, and they’re not set in stone. Microsoft has been clear that these are initial values that may change as they collect more feedback and telemetry from real applications. The goal is to flag usage that is atypical for well-performing apps, without overwhelming developers with noise.
How the feature works under the hood
To start using Network Efficiency Guardrails, developers first need to opt in by setting a Document Policy for their site. That happens at the HTTP response header level. A typical configuration looks like:
-
Document-Policy: network-efficiency-guardrails; report-to=neg-endpoint -
Reporting-Endpoints: neg-endpoint="/neg-reporting/"
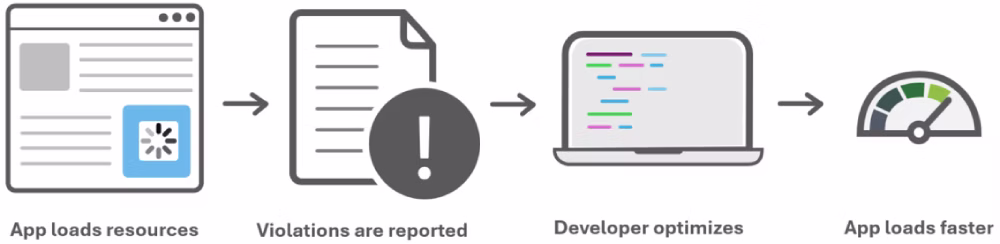
Once this is in place, Edge begins monitoring network activity for the page. When it finds an issue that violates the guardrails (for example, an oversized image or an uncompressed text response), it reports a policy violation using the Reporting API. Those reports are structured payloads sent back to your chosen endpoint, so you can store, analyze, and act on them over time.
If you don’t want to modify server code right away, you can also simulate these headers locally using DevTools by overriding HTTP response headers. This is a handy way to experiment with the feature and see what kind of violations your app generates before you commit to a full rollout.
Getting started in Microsoft Edge
Network Efficiency Guardrails is currently behind an experimental flag in Microsoft Edge 146, so you need to enable it before it takes effect. The setup steps are:
-
Open Edge and go to
edge://flags. -
Search for “Experimental Web Platform features”.
-
Set the corresponding flag to “Enabled”.
-
Restart the browser.
After that, you can enable the document policy on your site via response headers or via DevTools overrides. Once enabled, you simply use your app as normal, and Edge will automatically start generating reports whenever it detects inefficient resource usage.
Viewing and analyzing violation reports
There are two main ways to see what Network Efficiency Guardrails is catching:
-
In DevTools (client-side debugging):
-
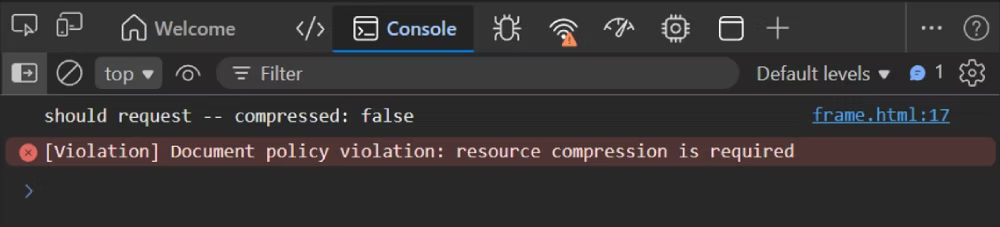
Violations appear as error messages in the Console, which is the quickest way to see what’s going wrong while you’re actively testing.
-
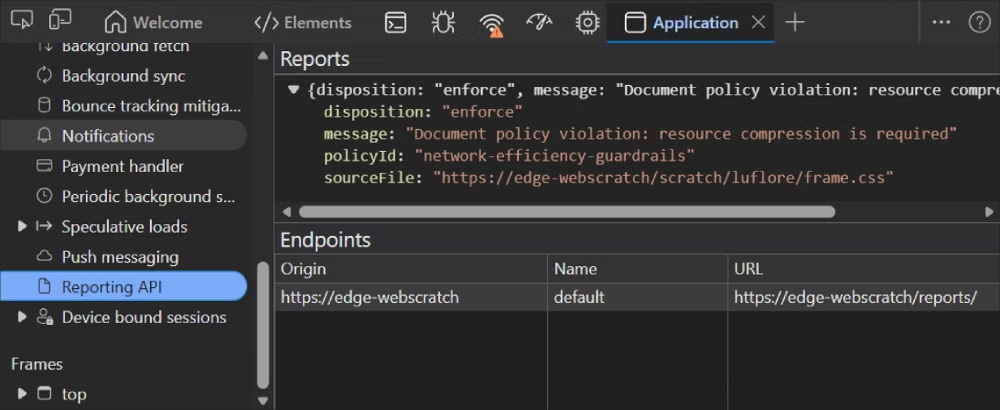
You can also open the Application tool and look under the Reporting API section for more detailed, structured reports.
-
-
On your server (production usage):
-
Configure the
report-toendpoint in the Document-Policy and Reporting-Endpoints headers to point to an actual server route, such as/neg-reporting/. -
Make sure that endpoint can receive JSON reports and handle preflight requests if you’re using a cross-origin endpoint.
-
From there, you can store these reports in logs or a database, feed them into your observability stack, and track performance issues over time.
-
This split approach lets you start small in development and later scale up to full production monitoring when you’re ready.
Accessing reports from JavaScript
Beyond server-side collection and DevTools, developers can also consume guardrail reports directly in client-side code. The browser exposes these through the Reporting client-side API:
-
Use the
ReportingObserverinterface to listen for reports as they are raised. -
Filter for entries where
ReportBody.featureId === "network-efficiency-guardrails"to focus specifically on these performance-related violations.
This opens the door to more advanced scenarios, such as:
-
Surfacing custom diagnostics in your own in-app developer tools.
-
Triggering client-side logging or UX adjustments when certain thresholds are hit.
-
Experimenting with different policies and seeing how they behave in real time without needing to wire up a backend first.
Early-stage feature with open questions
Network Efficiency Guardrails is still in an early development stage, and Microsoft is actively asking for developer feedback to shape how it evolves. They’re particularly interested in:
-
Fine-tuning existing thresholds: Adjusting size limits and conditions based on real-world data from diverse apps.
-
Adding new guardrails: Considering additional patterns that might be worth flagging, beyond large images, uncompressed text, and big data URLs.
-
Cross-frame reporting: Defining how parent frames should monitor child frames, whether bidirectional monitoring should be possible, and how enforcement should work when content is embedded.
Developers are encouraged to review the official explainer document for Network Efficiency Guardrails and share feedback or suggestions by opening issues on the feature’s GitHub repository.
For teams building complex, content-heavy web apps, this feature is a promising step toward more actionable, browser-driven performance insights. Instead of relying solely on synthetic tests or manual audits, Network Efficiency Guardrails turns the browser into an always-on watchdog for inefficient network usage—helping you spend your optimization time where it matters most.
Discover more from Microsoft News Now
Subscribe to get the latest posts sent to your email.
